April 2026
Test Your Access in One Click 🔎
Are you using an external BI tool? There’s now a self-serve “Test access” widget that runs the check and instantly tells you whether your access is working correctly - no more pinging support to find out.E-signing for Enterprise agreements
We are making it easier for our bigger customers to go through the onboarding process by stramlining the flow of approving and signing new agreements.Enhancements ⚡️
- Smoother Insight Builder - We’ve stopped the builder from firing duplicate queries, and save actions now wait for the current query to finish before committing. The result is fewer hiccups and more predictable behavior when you’re iterating fast.
- Drill-down in multi-pivot tables - Drilling into a parent-group cell in a pivoted table now opens the correct breakdown. Great update for our power-users.
Under development 🚧
We are putting the finishing touches on the new Reporting experience. It will merge Insights and Reports into one place, with an inline block editor and a shared insight library you can pull from across reports. This is our final stretch.March 2026
Comparison Periods in Reports 📊
Period comparisons now work directly in your report charts. Compare this month vs. last month, this quarter vs. last - right inside the Report Editor. No need to build separate insights to see how your metrics are trending.Enhancements ⚡️
- New Clients dashboard - Our Partners can now take advantage of a new dashboard that gives them a better overview of their clients using Enhanza.
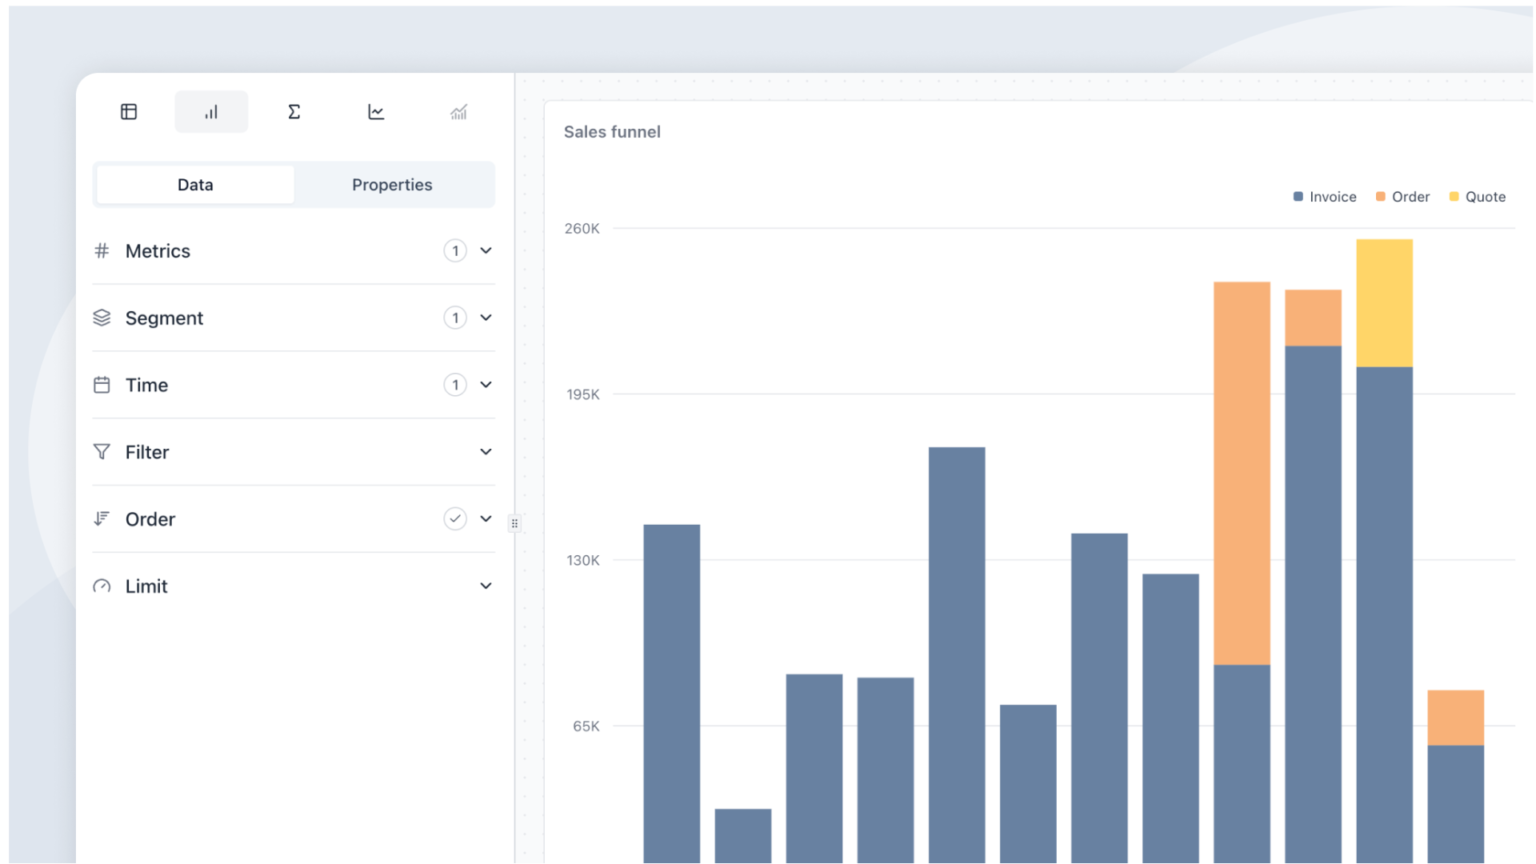
- Flexible bar charts - Bar charts now support time-based segmentation, giving you more ways to visualize trends over time.
- Chart date labels - Fixed date labels missing on small datasets and incorrect date formatting when splitting charts by dimension.
Breaking Ground 🚧
We’re working on a major reporting overhaul. Insights and reports are being unified into a single, more powerful experience - with inline editing, a new block-based editor, and a shared insight library. This will be the biggest update to Enhanza Reporting since the Insight Builder launch.We’re also building improvements to how you organize and group your dimensions in the Data Organizer.February 2026
A Faster, More Secure Platform 🚀
We’ve completed a major platform upgrade. Behind the scenes, we migrated our entire infrastructure to a new foundation - the result is faster page loads, smoother navigation, and enterprise-grade data security.Magic Link Sign-In 🪄
You can now sign in with just your email - no password required. Click the magic link in your inbox and you’re in. Of course, OAuth login through Google or Azure works exactly like it did before.Enhancements ⚡️
- Data pivot - We added a new pivoting option in the query builder, giving you even more flexibility to slice and dice your data.
- Insight Pilot currency - Insight Pilot now responds in your workspace’s currency, so answers feel natural to your business context.
- Data connection errors - Better error messages when data source connections run into trouble, so you know exactly what to fix.
January 2026
Speed & Performance ⚡
We’ve been investing heavily in making Enhanza faster. And the results are in. Pages load quicker, navigation feels snappier, and the overall experience is noticeably more fluid. This is the result of a significant behind-the-scenes rework, and it’s just the beginning. More speed improvements are on the way.Enhancements
- Insight Pilot improvements - Quality of life improvements to the Insight Pilot for a faster and smoother experience.
Breaking Ground
We’re working on some exciting things behind the scenes:- More speed coming soon - A major infrastructure upgrade is underway that will make the app even faster. The first wave of improvements has already shipped (see above), and the next phase is coming soon. We are focusing primary on speeding up the experience with reports.
December 2025
Data Organizer overhaul
The Data Organizer is getting a major upgrade with a versioning system and structured financial sections. We expect a full public rollout during Q1/2026.Enhancements ✨
- Better empty states in reports - When a report chart returns no data, you now see a clear “No Results” message instead of a blank space.
- Fresher data - We’ve updated our data caching strategy so your insights and reports reflect the most recent data available.
- Manual query execution - The Insight Builder now supports keyboard shortcuts for a faster workflow. And queries no longer auto-fire on every change. Build your query at your own pace, then run it when you’re ready.
November 2025
EUR Billing Migration 💶
We began the rollout and migration from SEK to EUR billing. This is a continuation of the new billing system launched in Octobe. Now we’re actively transitioning existing customers to EUR-based pricing for a smoother, more transparent billing experience across Europe.Enhancements ✨
- Payment issue alerts - If there’s an issue with your payment like an overdue invoice or a failed charge. You’ll now see a clear notification banner at the top of the app. No more silent billing problems.
- Faster tables - Tables with many columns now use column virtualization, which means they load and scroll significantly smoother.
- Improved error handling in reports - Report components now handle errors gracefully.
- Clearer checkout - The checkout flow now shows VAT details and plan breakdowns more clearly.
October 2025
New Billing System 🇪🇺
- EUR-based billing - We are moving one step closer to our international customers. EUR-base billing is perfect for our European customers who want predictable, local currency billing.
- Flexible payment options - Choose between credit card or invoice payments. Switch payment methods anytime through your account settings.
- Subscription management - Upgrade, downgrade, or modify your plan with just a few clicks. We make it really easy to manage your resources to make sure you are paying only for the things you actually use.
Enhanza Reporting
- Some customers reported issues with drilling down into their data. This has now been resolved
- Improvement to comparison queries has been released to make your year-over-year and period comparisons faster and more accurate. Compare any time period with confidence.
Breaking Ground 🚧
- We’re actively working on revisiting our data pipeline. This isn’t just an update - it’s a transformation that will bring rock-solid stability, blazing-fast sync speeds. On these foundations, we will be able to provide you with dozens of new connectors in the months ahead. The future of Enhanza is being built right now.
September 2025
New Pricing & Plans
- Simplified pricing structure that scales with your business. Choose the plan that fits your needs with transparent, predictable costs and better value at every tier.
Enhanza Reporting
- Formula Builder - Create calculated columns with our new drag-and-drop interface. You can now build complex calculations visually without writing a single formula.
- Total Column in Enhanza Supertable - See aggregated totals instantly. No more manual calculations or Excel exports needed to get your sum totals.
- Performance boost - Reports and insights now load faster with intelligent prefetching. We predict what you’ll click next and have it ready before you need it. Even further optimizations is yet to come.
New Marketing Website
- Fresh new look at enhanza.com! Our redesigned website better showcases how Enhanza transforms your business data into actionable insights.
Community Connection
- Ekonomi & Företag Fair - Great conversations in Stockholm! Thank you to everyone who visited our booth to share feedback and explore Enhanza’s capabilities. Your input directly shapes our roadmap.
August 2025
Enhancements and Performance
- Trigger a manual sync for multiple endpoints at once, even across all your data sources, with just one click.
- Automatic draft mode in the Data Organizer for safe iterations. All changes are saved automatically, so you never need to worry about losing your work. Organizing your data is now faster and more robust than ever.
- App-wide speed improvements for smoother, faster workflows.
Enhanza Reporting
- Supertable updates to make it even more intuitive and easier to work with.
- New filtering mechanism: compose your filters first, then commit them to the query once you’re done.
AI Assistant
- We’ve been working on something big! 🤯 Soon you’ll meet your personal BI analyst who is always at your service - ready to analyze data, create new insights, or even generate full reports from scratch. It’s currently in testing, please reach out if you’d like to become a beta tester yourself.
New Connector
- Tempo has been added to our connector family, allowing you to bring time-tracking data into your analysis.
July 2025
Extended user experience
- Lightning fast. ⚡️ Data is now loaded 10 times faster for better user experience. It will be improved even more during the summer.
- 3rd hierarchical level. Organize your dimensions in 3 hierarchical levels, instead of only 2. Test it now in your Data Organizer.
- Drill down. 🔎 Dig deeper. Drill down to individual vouchers in your financial reports. Also, drill down to customer and supplier invoices, and even open the orginal PDF directly from your Enhanza report.
- New docs. A new baby is born: Enhanza’s new docs, the knowledge base over how to get the most out of Enhanza.
- Trigger endpoint sync across multiple data sources. A highly requested feature from our bigger customers with many data sources.
- Export your data. Export any insight’s underlying data to .CSV with one click. Perfect for Excel analysis or sharing with stakeholders.
June 2025
Many improvements to the Insight Builder
- Comparison periods are here! Seamlessly compare any metric across time on almost any chart type.
- Number chart upgrade: Instantly see your metric, its trend, and how it’s changed compared to a selected period — all in one clean view.
- Calculated columns for tables. Pick any two columns, select a math operation and create your own metrics on the fly 🪄.
- Pie charts have landed. A classic, now in your toolkit.
- Cleaner, smarter settings. We’ve trimmed the clutter to keep what matters most. In our minds, simplicity = speed.
- Default time ranges on reports. Set a shared starting point for everyone viewing your report to guarantee the same experice for all.
Forecasting
- Something BIG is coming… We’re in a testing phase our new forecasting tool internally and collecting feedback from early users. Full availability is expected in July. Stay tuned, this one is worth it!
New Connector
- Tripletex joins the party as our 8th official integration 🥳.
May 2025
Enhanza goes global 🌍
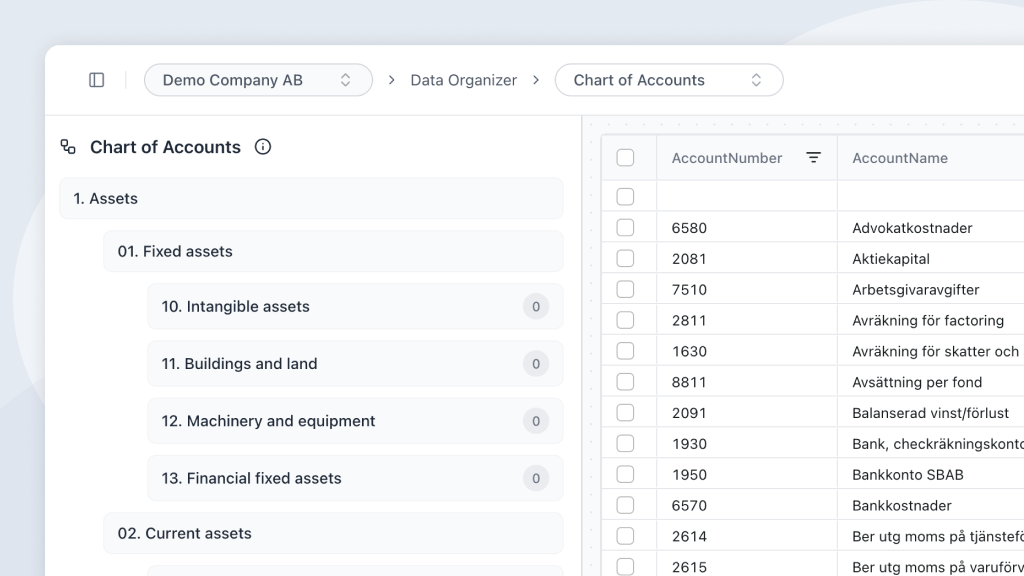
- Global chart of accounts. Do you have companies in different countries, not using the Swedish BAS? The new global chart of accounts allows you to map all account to one global standard. You can also create your custom.
- Multi currencies. Enhanza is now integrated with ECB (European Central Bank) via the Swedish Central Bank, collecting daily currency rates. Now you can select a default currency for which all your data is converted to. This is powerful for workspaces with multiple currencies. 💶
- Advanced filtering. Create unlimited condition bransches and carve out exactly the data you need. Test it out by creating an Insight.

April 2025
Launching the Insight Builder 🚀
The day has come! Enhanza’s new Insight Builder is live. It’s your tool for creating Insights from your data.- Select your metric and how to segment it.
- Choose time period and granularity (e.g. year, month, day).
- Add flexible filters to carve out the exact data you need.
- Order and limit the output to put your need.
- Choose how to present the output, as a Power Table or a optional grahp.
Organize your data
The different between hard and easy is structure.Create order from chaos with Enhanza’s new Data Organizer. Group and map any dimension (e.g. accounts, articles and projects) in a hierarchical structure. Then use these groups in the Insight Builder for multi level presentation.It’s very powerful. 💪🏼